Portfolio Rebalancing: How It Shapes Retirement Success for Aggressive and Conservative Withdrawals

Rajiv Rebello
Author
December 20, 2024

Author

The traditional asset allocation glide path involves shifting client assets away from stocks and toward bonds as they near retirement. This approach reduces portfolio volatility and mitigates sequence of returns risk, potentially increasing the chance of meeting retirement income goals.
Typical Retirement Glidepath towards Increasing Bond Allocation Near Retirement
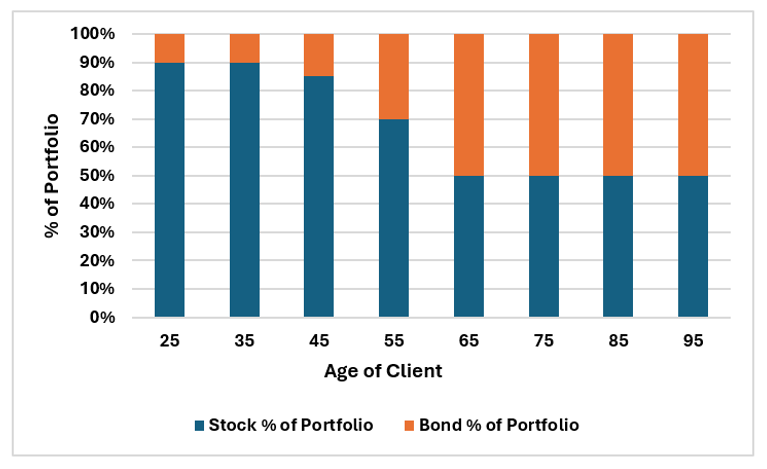
As clients get older and near retirement the standard asset allocation tends to “glide” away from a limited bond allocation and towards a heavier bond allocation in order to reduce risk in the portfolio. |
However, our findings suggest that the effectiveness of rebalancing versus alternative strategies depends heavily on a client’s withdrawal needs. For clients with aggressive withdrawal needs, rebalancing offers stability and higher success rates for meeting retirement goals. For clients with moderate withdrawal needs, avoiding rebalancing and prioritizing withdrawals from bonds first significantly increases after-tax wealth passed on to beneficiaries—with minimal impact on success rates.
Tailoring retirement strategies to withdrawal goals not only enhances portfolio outcomes but also maximizes wealth transfer opportunities for clients with lower withdrawal needs.
In this article, we analyze these strategies using two scenarios:
1. Aggressive Withdrawal Rate (4.3% withdrawal rate):
Annual withdrawals of $250k at age 65 (increasing at 2% each year for inflation) from a $5.8M portfolio.
2. Conservative Withdrawal Rate (2.6% withdrawal rate):
Annual withdrawals of $150k at age 65 (increasing at 2% each year for inflation) from a $5.8M portfolio.
Rebalancing is used primarily as a method of reducing the volatility of the portfolio. In rebalancing, the constituents of the portfolio are bought or sold at regular intervals such that their percentages relative to the portfolio value is maintained at a certain level.
For example, in a traditional portfolio, 60% of the assets are allocated to stocks and 40% are allocated to bonds. So for example, if the stock part of the portfolio grows at a higher rate than bonds for a given year, the proportion of stocks will be higher than the original 60% at the beginning of the year.
What the rebalancing approach then aims to do is reset the allocations to the desired 60/40 allocation at the end of the year. This is done by simply selling some stocks and using the cash generated to buy more bonds thus maintaining the 60/40 allocation.
One might wonder how taking money out of an asset that grows at a higher rate and transferring it into an asset that grows at a lower rate is a good strategy. It seems counterintuitive to the idea that money should remain in assets that grow at a higher rate. But an asset offering a higher rate of return often comes with higher risks and hence, higher volatility.
The idea of rebalancing is to optimize the return of the portfolio relative to the volatility. So while the stock portion of the portfolio is providing the higher returns, the bond part of the portfolio is providing the reduced volatility. What is often overlooked in this strategy, however, is the unfavorable tax implications and lower yields of investing in fixed income assets versus the tax advantages and higher returns provided by the equity assets.
To understand the impact of rebalancing, we analyzed three strategies under the Aggressive and Conservative Withdrawal scenarios we described above. The Aggressive Withdrawal Rate is a 4.3% withdrawal rate while the Conservative Withdrawal rate is a 2.6% withdrawal rate.
The three strategies compared are:
1. With Rebalancing:
The “With Rebalancing” strategy involves the portfolio being rebalanced once a year in order to maintain a 60% stock/40% bond allocation.
2. No Rebalancing:
The “No Rebalancing” strategy involves not rebalancing the portfolio. This means that if equities outperform bonds over the long run, the percentage allocation to equity assets will increase over time. The opposite is true if equities underperform bonds over the long-run. Withdrawals are done in accordance with the portfolio allocation percentages at the time. For example, if the portfolio at the time is 82% stocks and 18% bonds then 82% of the withdrawal will be taken from the stock portfolio and 18% will be taken from the bond portfolio in order to maintain the same percentage as before the withdrawal.
3. No Rebalancing But Bond Withdrawals First:
The “No Rebalancing But Bond Withdrawals First” strategy involves the portfolio not being rebalanced as was done in the second strategy above. However, in this case withdrawals are not done on a pro-rata basis based on the portfolio allocation at the time. The withdrawals are done entirely from the bond portfolio first until they are depleted. Then withdrawals are done from the stock portfolio. This means that the percentage of the portfolio allocated to stocks will increase over time as bond portfolio assets are depleted.
We can see the results of this below.
Effect of a 4.3% Withdrawal Rate on Retirement Outcomes
Successful Scenarios of Meeting Retirement Goal | After-Tax Median Portfolio Value at Age 95 | Ratio at Age 95 | |
|---|---|---|---|
| With Rebalancing | 56% | $1,451,562 | 0.97 |
| No Rebalancing | 52% | $744,682 | 0.89 |
| No Rebalancing (Withdrawals From Bond Portfolio First) | 54% | $1,037,761 | 0.79 |
Modeling Assumption After-tax risk free rate used in Sharpe ratio is 2.6% *In the rebalancing strategy, withdrawals are taken such that the 60/40 allocation is maintained. In the no rebalancing strategy, withdrawals are taken based on the prevailing allocation %s in equity and bond. In the no rebalancing strategy (alternate), withdrawals are taken from bond first until it is depleted and then from equity. |
There are a number of insights we can derive from the table above as summarized in the bullets below:
Insights:
The high level takeaway here is that due to the aggressive withdrawal rate (4.3% of the portfolio), rebalancing offers the best chance of retirement success.
Choosing not to rebalance imposes more risk on the client’s retirement goals without notable upside.
However, if we reduce the withdrawal rate from 4.3% to 2.6% we see different outcomes.
Effect of a 2.6% Withdrawal Rate on Retirement Outcomes
Successful Scenarios of Meeting Retirement Goal | After-Tax Median Portfolio Value at Age 95 | Ratio at Age 95 | |
|---|---|---|---|
| Rebalancing Strategy | 94% | $11,074,305 | 1.25 |
| No Rebalancing Strategy | 94% | $10,808,305 | 1.12 |
| No Rebalancing (Withdrawals From Bond Portfolio First) | 89% | $12,829,497 | 0.99 |
Modeling Assumption After-tax risk free rate used in Sharpe ratio is 2.6% *In the rebalancing strategy, withdrawals are taken such that the 60/40 allocation is maintained. In the no rebalancing strategy, withdrawals are taken based on the prevailing allocation %s in equity and bond. In the no rebalancing strategy (alternate), withdrawals are taken from bond first until it is depleted and then from equity. |
There are a number of insights we can derive from the table above as summarized in the bullets below:
Insights:
In the above table, we can see that in the conservative withdrawal rate scenario that while the No Rebalancing Strategy (Withdrawals From Bond Portfolio First) slightly reduces the chance of retirement success, it improves the median after-tax wealth by 16% compared to the Rebalancing Strategy ($12,829,497 vs $11,074,305).
The next question we should be asking is why is this?
And the answer here is that with a low withdrawal rate, there is less pressure on the portfolio to meet the client’s income goals. So even if there is a downturn in the market, the sequence of returns risk is significantly lower than when the withdrawal rate is higher. Furthermore, since there is no rebalancing and equity returns are higher than bond portfolio returns, the No Rebalancing (Withdrawals From Bond Portfolio First) allows the portfolio to drift towards a higher equity percentage over time as opposed to the 60/40 portfolio that maintains a fixed equity allocation.
Furthermore, equity returns are more tax-efficient than bond returns due to the fact that unrealized gains are not taxed whereas bond returns are taxed every year. So a larger equity allocation reduces the tax burden on the portfolio on top of typically providing a higher return profile.
Rebalancing is a critical strategy for retirees aiming to withdraw larger amounts annually. It maintains portfolio stability, reduces risk, and delivers higher risk-adjusted returns while leaving a meaningful inheritance.
The no-rebalancing approaches do not provide the same level of stability and success when retirement income withdrawal rates are high.
However, when withdrawal rates are lower clients can help create notably higher after-tax wealth for their beneficiaries with only a slight decrease in their chances of meeting their own retirement income needs.
Choosing the right strategy depends heavily on a retiree’s priorities. For those who value income security and risk management, rebalancing remains the gold standard. For clients with lower withdrawal needs who prioritize wealth transfer, the no rebalancing strategy with bond-withdrawal-first strategy is an attractive alternative. Ultimately, the decision lies in balancing income stability with long-term wealth preservation goals.
By tailoring these strategies to individual retirement needs, advisors can help clients achieve their goals more effectively while addressing key concerns like risk, tax efficiency, and legacy planning.
Ready to determine which rebalancing strategy aligns with your retirement goals? Schedule a consultation with our experienced financial advisors to create a personalized retirement income plan that balances your needs for stable income, risk management, and legacy planning. Contact us today to start optimizing your retirement portfolio strategy.
Book a CallAuthor

Learn how to evaluate PPLI carriers by balancing financial strength ratings against investment platform flexibility. Compare fee structures and long-term costs to select the optimal Private Placement Life Insurance carrier for your wealth strategy.

Determining the right death benefit level for your Private Placement Life Insurance (PPLI) policy is one of the most critical decisions that will impact your policy’s performance, costs, and overall effectiveness. This comprehensive guide explores how to balance regulatory requirements, estate planning needs, family protection goals, and investment capacity optimization to find the optimal death benefit level for your unique circumstances.

Master essential best practices for PPLI investment committee governance. Learn to establish effective oversight structures, develop robust policies, and implement risk management frameworks that maximize wealth preservation while ensuring regulatory compliance.
0 Comments