How Advisors Using Traditional Retirement Models are Costing their Clients Millions

Rajiv Rebello
Author
January 07, 2025

Author

The choice to use an advisor in retirement is one that will cost clients and their beneficiaries millions of dollars in both fees and opportunity costs as we’ll show later in this article. If advisors are simply allocating clients to traditional stock-bond investment models without implementing any actual retirement, investment planning or estate planning solutions, clients will never recoup this fee.
The word fiduciary gets utilized a lot by AUM based advisors who claim to be acting in the client’s best interests because their fee model aligns incentives with that of the client. The idea here is that by providing long-term advice, and charging for it on an ongoing basis, the fee-only advisor helps to align interests with the client more-so than an advisor who only sells products that earn a large, one-time upfront commission.
The reality of the situation is that the AUM based advisor has similar conflicts of interest—namely to advocate for solutions that they can charge their AUM fee on
If there is a better fit for the client that doesn’t allow the AUM based advisor to charge a fee on or would result in a reduction in the AUM fee but is ultimately better for the client’s goals, then the AUM advisor has the same conflict of interest as the commission-based advisor.
This conflict is most evident when clients enter retirement. The traditional glidepath for AUM advisors involves increasing the allocation away from stocks towards bonds as clients near retirement in an attempt to reduce the volatility of the portfolio and protect against sequence of return risk so that the client can withdraw a steady stream of income every year in retirement without fear of running out of money.
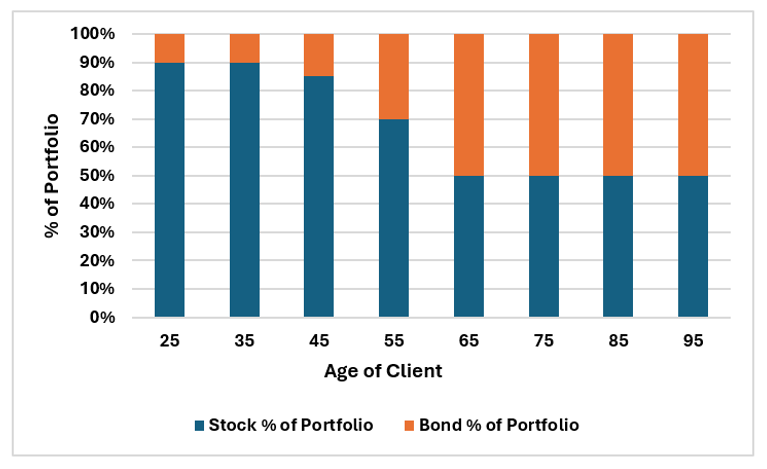
As clients age and near retirement, retirement portfolios shift the asset allocation away from stocks and towards a heavier bond allocation. |
However, for clients in high tax-brackets, the increasing allocation to bonds doesn’t add much value to either their chance of meeting their retirement income goals or long-term after-tax wealth. And that’s because the heavy taxation of bond income (it’s all taxed at high ordinary-income rates), negates a lot of the value they provide in derisking the portfolio.
This is further worsened when an advisor charges an ongoing fee for managing the portfolio.
And that’s because the advisor is essentially charging a fee for moving clients away from the higher-earning and more tax-efficient stock portfolio and towards a lower-earning and more tax-inefficient bond portfolio.
The advisor’s fee as a percentage of the after-tax bond return is often 25%-50% of the total after-tax bond return.
That’s a ridiculous proposition to make.
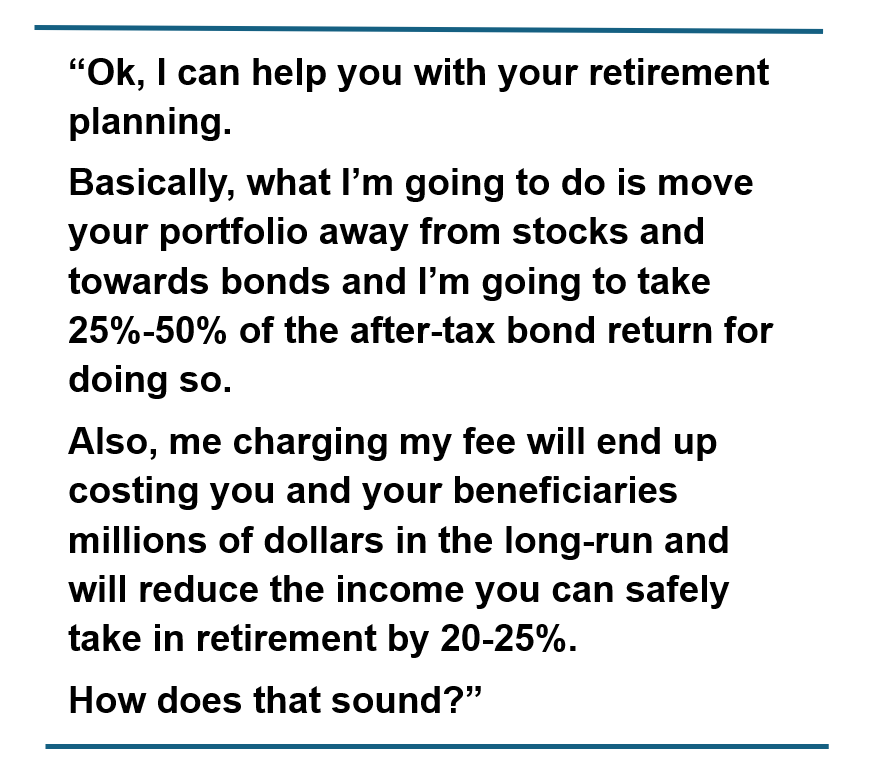
Imagine if I were to go to an advisor looking for retirement planning help and he said the following:
“Ok, I can help you with your retirement planning. Basically what I’m going to do is move your portfolio away from stocks and towards bonds and I’m going to take 25%-50% of the after-tax bond return for doing so.
Also, me charging my fee will end up costing you and your beneficiaries millions of dollars in the long-run and will reduce the income you can safely take in retirement by 20-25%.
How does that sound?”
Putting retirement clients into a similar stock-bond allocation model easily allows advisors the ability to quickly allocate these clients to this type of retirement model and charge their fee on the assets. It’s a business model that is easily scalable.
Unfortunately the business model that may be the best fit for the advisor, may not be the best fit for the client’s retirement goals.
A typical part of a retirement financial plan includes an asset allocation that provides an expectation of success of meeting a given retirement goal given a desired level of spending in retirement. For example, let’s assume that a client has $6 million in assets at the time of retirement and desires to spend $250,000 per year in retirement (a 4% spending rate). What is the chance of the client meeting that goal in retirement and how much after-tax wealth will the client have left to provide to the client’s beneficiaries at death?
These two retirement goals—retirement income and ending after-tax wealth—are thought to be at odds with one another when we limit asset allocation between stocks and bonds.
In order to increase the chance of meeting the retirement goal, the thought is that you need to move away from higher-earning, more volatile stocks towards lower-earning, less volatile bonds. So in order to meet the retirement goal, you are sacrificing long-term wealth—and vice versa.
A key step of a financial plan for retirement is to determine the amount of income that client would need in retirement. The next step is to run a Monte Carlo simulation and determine the chance that the client would be able to meet those retirement income goals using a predefined asset allocation (e.g. 70% stocks/30% bonds or 60% stocks/40% bonds) if the client were to live to a given age (e.g. 95).
It’s helpful to look at this through the lens of a case example. So let’s look at a sample case, and see how various stock/bond allocations affect both the client’s chance of meeting their retirement income goals as well as the after-tax wealth that they leave to their beneficiaries.
So let’s assume we have a married 55 year old couple living in California (e.g., a state with high income taxes). They currently have a portfolio of $3 million and are planning at retiring at age 65. They expect that they will need $250k/year in income in retirement to support their spending needs. They expect that this spending need will grow by 2% a year to keep up with inflation.
What is their chance of meeting their retirement income needs with various stock/bond asset allocations?
The table below helps us answer that question.
| Stock/Bond Allocation | Chance of Meeting Retirement Income Goals to Age 95 | Median After-tax Wealth at Age 95 |
| 100%/0% | 57% | $3,490,531 |
| 70%/30% | 58% | $2,053,519 |
| 60%/40% | 56% | $1,451,562 |
Meeting retirement income goal at different Equity/Bond portfolio allocation: Modeling assumptions |
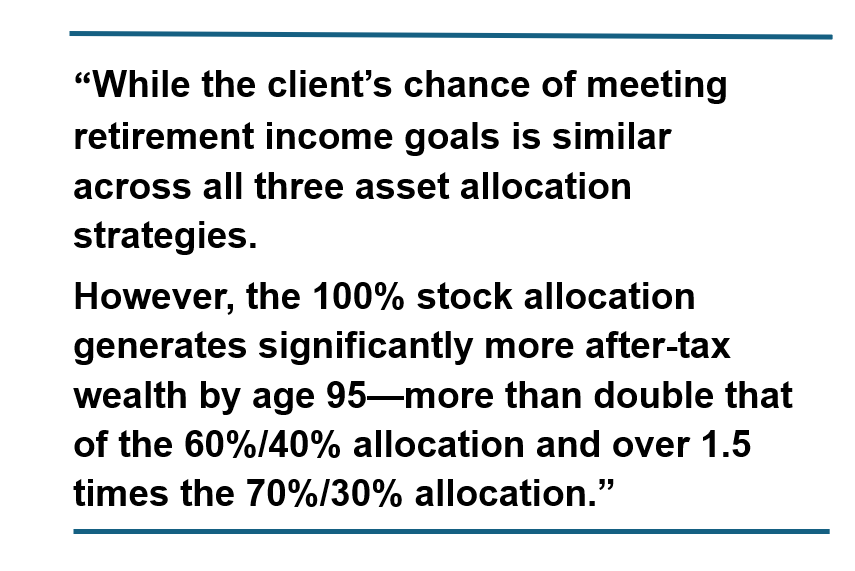
As the table above shows, while the client’s chance of meeting retirement income goals is similar across all three asset allocation strategies. However, the 100% stock allocation generates significantly more after-tax wealth by age 95—more than double that of the 60%/40% allocation and over 1.5 times the 70%/30% allocation.
As evidenced in the previous table, a HNW couple with the above retirement income goals has a better chance of meeting those retirement goals with a higher stock allocation as well as a leaving a larger amount of wealth for their beneficiaries. This is primarily due to the fact that stock gains have higher returns and more tax-efficient than bond gains. So shifting away from higher earning, tax-efficient stock returns towards lower-yielding, tax-inefficient bond returns hurts individuals in a higher tax-bracket over the long-run.
| Returns | Standard Deviation | |||||
|---|---|---|---|---|---|---|
Return IRR | Return IRR | Return IRR | Return Standard Deviation | Return Standard Deviation | Return Standard Deviation | |
| 9.33% | 5.82% | 3.68% | 19.23% | 18.97% | 1.68% | |
Bond | 6.47% | -0.09% | 6.57% | 7.67% | 6.57% | 2.92% |
Source: Damodaran, Fed Reserve
Since 1928, the S&P 500 has far exceeded the returns of the bond market. While the S&P 500 has higher volatility than bonds, as measured by the standard deviation, the bulk of the S&P 500 returns come from price return which have numerous tax advantages whereas the bulk of bond returns come from dividends which are taxed at high ordinary income rates. Furthermore, the bulk of the risk of bonds comes from the price return of bonds, while the stability comes from the dividend paying portion of bonds. |
Many investors might not realize that the bulk of stock returns are due to the price return of the stock, whereas the bulk of bond returns are due to the dividend return of the bond. And bond dividend returns are taxed at significantly higher ordinary income rates than the long-term capital gains rates of price returns. Stock dividends are also often taxed at qualified dividend rates which are significantly lower than the ordinary income taxation rates of bonds.
Furthermore, the price return of an asset is only taxed when that asset is sold. This means stock investments allow these unrealized price return gains to compound tax-free. If the investment is held until death of the owner of the stock investment, then the owner’s beneficiary will be able to inherit that asset without paying any taxes on the gains of the price differential between the share price that the owner purchased it and the share price at the time the original owner passed away through a provision known as step-up in basis (provided that the value of the original owner’s estate is under the current estate tax limits at that time).
This is a huge benefit to buy and hold investors who invest in equity assets like the S&P500 for the long-term. Bond investors won’t benefit through step-up in basis nearly as much over the long-term hold approach since the price return on bond returns over the long-term are small. Note that in the above table the annualized price return of bonds from 1928-2023 was actually -0.09%.
These are important to note because retirees will often live 20 to 30 years post retirement. The shift away from higher-yielding, tax-efficient stocks to lower-yielding, tax-inefficient bonds has a significant impact on the after-tax wealth high net worth individuals leave to their beneficiaries.
This is exactly why in the previous table we saw that choosing a 100% stock portfolio left more than double the after-tax wealth to their beneficiaries than the 70/30 or 60/40 portfolios. When you have a 100% stock portfolio very little of your gains are taxed each year. However, 100% of your bond portfolio gains each year are taxed.
In previous articles I’ve written, I’ve talked about how HNW clients should utilize asset location and place tax-inefficient parts of their portfolio within tax-advantaged wrappers.
Now that we’ve covered why the high taxation of bonds make them not reliable for retirement income planning for HNW clients, let’s now look at how paying an ongoing AUM fee to an advisor for shifting the portfolio away from stocks and towards bonds as a retirement planning strategy is so devastating.
A financial advisor typically charges a fee that is a percentage of a client’s assets. This fee is generally around 1% of a client’s assets. On top of this, the client also will pay custodian fees and fund management fees which can add an additional 20 to 40 basis points. So, for example, if a client has $1M in assets, the advisor would typically charge a $10,000/annual fee and the client would pay an additional $2,000 to $4,000/year fees for custodian and fund management services. This means the total advisory costs would be 1.2% to 1.4%. For the sake of our analysis we’ll assume that the total advisory fee is only 1%. But readers should be aware that the true cost of using an advisor is much higher than this and has been shown to be about 1.65%.
There are two problems with this type of fee structure in retirement:
1) The advisor is typically changing the asset allocation away from higher yielding stocks and towards lower yielding bonds in retirement
This means that the advisor’s fee now makes up a larger portion of the client’s overall return. If the stock portfolio is earning 8% and the bond portfolio is earning 4%, then a 1% fee is only 12.5% (1%/8%=12.5%) of the return of the stock portfolio, but is 25% of the return of the bond portfolio (1%/4%=25%). When we add taxes into this, then the advisor’s percent of the client’s after-tax return is even higher as we’ll see down below.
So as the advisor increases the client’s allocation to bonds in retirement, the advisor’s fee relative to the client’s return starts to get increasingly high and eats into wealth and retirement income that would have otherwise gone to the client.
2) The advisor’s fee is paid on an after-tax basis
Another problem with the percent of AUM fee in retirement is that the advisor’s fee gets paid after-taxes. This further reduces the retirement income and long-term wealth of the client as the advisor fee relative to the client’s after-tax income is now higher.
As an example, let’s assume a client has a $1M bond portfolio that earns 4%, or $40,000. Let’s assume the client’s effective tax-rate is 25%. That means the client pays $10,000 in taxes and is left with $30,000 after taxes. The client then has to pay the advisor’s 1% fee, or $10,000 which is 33% of the client’s after-tax income. So the after-taxes and the advisor’s fee, the client is left with only $20,000. So the advisor’s fee is 33% of the client’s after-tax return. Of the total 4% gross return, the client only makes 2% after taxes and advisory fees.
(A) | (B) | Taxes (C)=(B)*(A) | Return Before Advisory Fees (D)=(A)-(C) | Cost of Advisor (D) | Tax Return to Client (E)=(D)-(C) |
|---|---|---|---|---|---|
| 4.00% | 25.00% | 1.00% | 3.00% | 1.00% | 2.00% |
On a 4% gross return, the client is losing 1% to taxes. Of the 3% after-tax return, the advisor is taking up 1/3 of the client’s return with a 1% fee leaving the client with only 2% after-taxes and after-advisory fees. In the case above, the advisor is utilizing bonds as a retirement solution and the cost of that retirement solution is 33% of the after-tax return-all of which is due to the cost of the advisor. |
There are a number of important questions to ask here:
1) Is shifting the portfolio allocation away from equities and towards bonds a viable retirement solution to begin with relative to other retirement solutions available?
2) What is the impact on the client’s ability to meet their retirement income goals and on ending wealth if the fiduciary advisor they hired to help them takes 33% or more of the client’s after-tax income from the retirement solution they recommended?
When an advisor uses a higher bond allocation in place of a proper retirement solution, this is the actual drag that is taking place due to the advisor’s fee since the taxable bond solution is both lower-yielding and highly taxable.
Is that really a fiduciary retirement solution to recommend a client give up 33% of their returns for the rest of their life with no protection or guarantees that the client will be able to safely withdraw a given amount of income?
And more importantly, are there better solutions out there that actually help improve both retirement income goals and wealth than the traditional stock-bond asset allocation the fee-only advisor is recommending?
We can quantify the impact of this using the same financial planning simulations that we did above. In other words, previously we saw the chance of a client meeting their retirement income goals using different asset allocations. What would these chances look like if we added in the cost of a financial advisor? What would the impact be on wealth at age 95 be?
| No Advisor Fee | 1% Total Advisory Fee | |||||||
|---|---|---|---|---|---|---|---|---|
Allocation | Meeting Retirement Income Goals to Age 95 | After-Tax Wealth at Age 95 | After-Tax IRR at Age 95 | Ratio at Age 95 | Meeting Retirement Income Goals to Age 95 | After-Tax Wealth at Age 95 | After-Tax IRR at Age 95 | Ratio at Age 95 |
| 57% | $3,490,531 | 5.01% | 0.57 | 42% | $0 | 3.78% | 0.25 | |
| 58% | $2,053,519 | 4.75% | 0.86 | 36% | $0 | 3.58% | 0.35 | |
| 56% | $1,451,562 | 4.63% | 0.97 | 31% | $0 | 3.45% | 0.38 | |
Charging a 1% total advisory fee while shifting client assets away from tax-efficient stocks and towards tax-inefficient bonds hurts the same retirement income and wealth goals the advisor is seeking to solve for the client. |
The table above highlights the substantial effect of a 1% ongoing advisory fee on a client’s ability to meet retirement income goals and maintain after-tax wealth. This impact is particularly pronounced for clients shifting from a 100% stock allocation to portfolios with higher bond allocations, such as a 70/30 or 60/40 stock-to-bond mix. Unless the advisor implements strategies that create additional value, the fee significantly diminishes the client’s financial outcomes.
Charging a 1% advisory fee reduces the likelihood of meeting retirement goals by 150 to 250 basis points, depending on the portfolio allocation. Furthermore, the reduction in after-tax wealth left to beneficiaries is considerable:
The heavier the bond allocation of the portfolio, the more severe the financial impact of the advisory fee. For example, a 60/40 allocation reduces the chance of meeting retirement goals by 250 basis points and depletes all after-tax wealth, compared to maintaining a 100% stock allocation with no fee which only reduces the chance of retirement success by 150 basis points.
This is because the portfolio with a heavier bond allocation results in less growth over the long-run as opposed to a portfolio with a heavier stock allocation due to the reduced growth rate and higher taxation of bonds in comparison to the stock part of the portfolio.
So our couple who is 55 and waiting until 65 to retire will on average see less growth in a portfolio that is bond heavy as opposed to stock heavy. This means that if our couple has a heavier bond allocation in their portfolio, when they start taking their $250k inflation-adjusted annual withdrawal amount at age 65 that amount will be a larger portion of their portfolio at age 65 than if they had a larger equity position from age 55 to 65.
In other words, their withdrawal rate (withdrawal amount/portfolio value at age 65) will be higher if they have a larger bond allocation than if they have a larger equity allocation. Analogously, if our couple is using an advisor, that advisory fee will drag down the portfolio value at age 65 as well. So clients that are using an advisor will have a higher withdrawal rate than those who do not.
We can see the effects of both a heavier bond allocation and the use of an advisor on withdrawal rates at age 65 in the table below.
| Stock/Bond Allocation | $250K Median Withdrawal Rate Without Advisory Fee | $250K Median Withdrawal Rate with 1% Advisory Fee |
| 100%/0% | 3.9% | 4.3% |
| 70%/30% | 4.2% | 4.6% |
| 60%/40% | 4.3% | 4.7% |
Since a 1% advisory fee causes drag on the portfolio, by the time our 55 year old couple reaches age 65 the value of their portfolio with the 1% advisory fee is at a lower value than if they didn’t have the advisory fee. This means that their $250k/year desired withdrawal is a higher percentage of their overall portfolio (i.e. a higher withdrawal rate) when they have an advisor as opposed to if they didn’t. |
As expected, we can see that a portfolio that has a 100% stock allocation with no advisor has a lower withdrawal rate at age 65 (3.9%) than a portfolio that has a 60% stock/40% bond allocation and pays a 1% advisory fee (4.7%).
The larger withdrawal rate for the portfolios that have a heavier bond allocation and use an advisor explain why the after-tax wealth at age 95 for these portfolios have a lower values than their counterparts since a larger withdrawal rate more rapidly depletes the portfolio.
Another way of thinking about the effect of the advisory fee on retirement success is to ask ourselves the question:
What is the effect of the advisory fee on my ability to withdraw income from my portfolio?
How much would I have to reduce the income I can safely withdraw from my portfolio to account for the drag of the advisory fee?
We can see that by reducing the withdrawal rate of our client example and seeing how low that withdrawal rate has to be when using an advisor in order to equal their chance of retirement success without using an advisor.
First, let’s revisit our original client example without an advisory fee.
In our original example, the client was planning on withdrawing $250,000 per year in retirement (with a 2% increase each year for inflation)—and not using an advisor.
Let’s first compare retirement outcomes using that assumption along with the retirement outcomes that would be possible if they reduced their desired withdrawal in retirement from $250,000 per year in retirement to $198,000 per year.
In both cases no advisor is used.
From a withdrawal rate perspective, the $198k inflation-adjusted annual withdrawal amount is a lower percentage of the portfolio than the $250k inflation-adjusted annual withdrawal amount.
We can see the actual withdrawal rates of the $198k inflation-adjusted annual withdrawal amount below.
| Stock/Bond Allocation | $198K Median Withdrawal Rate Without Advisory Fee | $198K Median Withdrawal Rate with 1% Advisory Fee |
| 100%/0% | 3.1% | 3.4% |
| 70%/30% | 3.3% | 3.7% |
| 60%/40% | 3.4% | 3.8% |
Reducing the withdrawal amount from $250k to $198k drastically reduces the withdrawal rates on the portfolio from 3.9% to 4.3% without an advisor to 3.1% to 3.4% and from 3.9% to 4.3% with an advisor to 3.4% to 3.8%. |
We can compare the withdrawal rates from Table 6 above to Table 5 with the $250k inflation-adjusted annual withdrawal amount.
Lowering the inflation-adjusted withdrawal from $250k per year to $198k per year reduces the withdrawal rate on the portfolio from 3.9% to 4.3% without an advisor to 3.1% to 3.4% and from 3.9% to 4.3% with an advisor to 3.4% to 3.8%.
This is roughly an 80 basis point decrease in the withdrawal rate.
As can be expected, lowering the annual withdrawal rate from $250,000 to $198,000 significantly improves retirement outcomes across all portfolios:
| No Advisor Fee $250k Withdrawal | No Advisor Fee $198k Withdrawal | |||||||
|---|---|---|---|---|---|---|---|---|
Allocation | Meeting Retirement Income Goals to Age 95 | After-Tax Wealth at Age 95 | After-Tax IRR at Age 95 | Ratio at Age 95 | Meeting Retirement Income Goals to Age 95 | After-Tax Wealth at Age 95 | After-Tax IRR at Age 95 | Ratio at Age 95 |
| 57% | $3,490,531 | 5.01% | 0.57 | 71% | $9,572,432 | 5.23% | 0.66 | |
| 58% | $2,053,519 | 4.75% | 0.86 | 77% | $7,367,077 | 4.90% | 0.97 | |
| 56% | $1,451,562 | 4.63% | 0.97 | 79% | $6,317,721 | 4.76% | 1.10 | |
Without advisory fees, a more balanced portfolio (e.g., 70/30 or 60/40) provides better risk-adjusted returns, as reflected in higher Sharpe ratios. However, these benefits are offset by significantly lower after-tax wealth compared to a 100% stock allocation.
Table 7 above showed that a $198k inflation-adjusted annual withdrawal amount leads to improved retirement outcomes. However, that was with a portfolio with no advisory fee.
Table 8 below shows the effect of adding a 1% advisory fee to that portfolio while still trying to meet the $198k inflation-adjusted annual withdrawal amount.
| $198k Withdrawal No Advisor Fee | $198k Withdrawal 1% Total Advisory Fee | |||||||
|---|---|---|---|---|---|---|---|---|
Allocation | Meeting Retirement Income Goals to Age 95 | After-Tax Wealth at Age 95 | After-Tax IRR at Age 95 | Ratio at Age 95 | Meeting Retirement Income Goals to Age 95 | After-Tax Wealth at Age 95 | After-Tax IRR at Age 95 | Ratio at Age 95 |
| 71% | $9,572,432 | 5.23% | 0.66 | 57% | $2,237,097 | 3.89% | 0.30 | |
| 77% | $7,367,077 | 4.90% | 0.97 | 58% | $1,349,830 | 3.65% | 0.43 | |
| 79% | $6,317,721 | 4.76% | 1.10 | 56% | $846,302 | 3.55% | 0.46 | |
Charging a 1% total advisory fee on a portfolio with a $198k annual withdrawal amount results in the same chance of retirement success as a portfolio with a $250k annual withdrawal amount with no advisory fee. In other words, the client would lose $52,000 in annual income (20%) by choosing to work with an advisor. The advisor would need to find a way to overcome this just for the client to break even. |
Table 8 shows that the adding a 1% advisory fee to a portfolio with a $198k inflation-adjusted annual withdrawal amount results in the same chance of retirement success as if that portfolio had a $250k inflation-adjusted annual withdrawal amount and NO advisory fee.
In other words, charging a 1% advisory fee is the mathematical equivalent of reducing the amount the client can safely withdraw in retirement by $52,000 (21%).
It’s also worth looking at the immense loss in after-tax wealth that happens on the portfolio when you add on a 1% fee to the portfolio while taking a $198k inflation-adjusted annual withdrawal.
Table 9 below shows us the comparative loss due to the advisory fee.
| Stock/Bond Allocation | Median After- Tax Wealth at Age 95 With No Advisory Fee | Median After- Tax Wealth at Age 95 With 1% Advisory Fee | Loss of Wealth Due to Advisory Fee |
| 100%/0% | $9,572,432 | $2,237,097 | -77% |
| 70%/30% | $7,367,077 | $1,349,830 | -82% |
| 60%/40% | $6,317,721 | $846,302 | -87% |
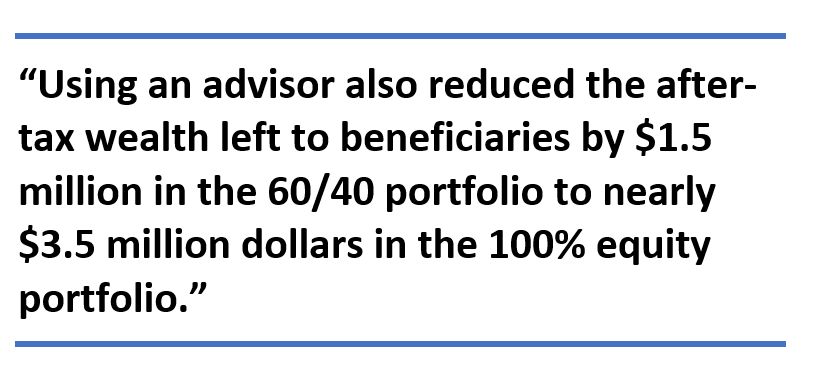
As the table above shows, the drag of a 1% advisory results in a loss of 80% or more of the after-tax wealth that would have accrued had the couple not used an advisor. This is a loss of millions of dollars that is nearly impossible for even the best financial advisors to make up for.
When clients have a low withdrawal rate then their portfolio is able to compound at greater rates than if they have a higher withdrawal rate. Clients with a high net worth typically have lower withdrawal rates than their less wealthy counterparts since they don’t need to withdraw as much from their portfolio to support their ongoing living expenses.
But if clients are using an advisor charging an ongoing AUM fee while providing little to no value add, then the value of reducing the withdrawal rate is negated because advisory fee is eating up all the wealth they though they were creating by having a lower withdrawal rate.
These clients would have been better off mathematically by not using an advisor and having a higher withdrawal rate.
Ironically, they are trying to be financially savvy by having a lower withdrawal rate and going to an advisor instead of spending more on their own.
These high net worth clients with low withdrawal rates would be 100% better off from a math perspective by going with an all equity withdrawal rate due to the higher earning and lower tax-liabilities than paying an advisor to invest in a portfolio with a heavier bond allocation.
As this article shows, they would have higher chances of meeting their retirement income goals ANDmaximizing the wealth they leave to their beneficiaries by investing in a simple index fund or target date fund on their own than paying an advisor who adds little value but ends up reducing their chance of meeting their retirement income goals while costing them and their beneficiaries millions in after-tax wealth over the long-run.
Financial planning in retirement can have immense value. This includes creating tax-efficient investment and withdrawal strategies from a client’s taxable, tax-deferred, and tax-free accounts as detailed in previous Advisor Perspective articles by Pfau and Reichenstein.
However, if clients are paying an ongoing fee in retirement that costs the client and their beneficiaries millions of dollars, then the value of this planning must at the very least offset these costs to make the planning worthwhile.
The wealthier an individual is the more they need complicated estate, tax, investment, and retirement planning solutions that are all integrated together to make sure the pieces all complement each other well.
Many advisors retirement strategy for clients simply involves shifting the allocation from stocks to bonds. This is hardly the sophisticated retirement strategy I’m referring to here.
In fact, shifting the clients away from stocks to bonds actually hurts the majority of clients—particularly those in high tax brackets—as this article showed.
Bonds are lower yielding, and more tax-inefficient than stocks.
In fact, the ability of bonds to provide diversification benefits to portfolios has been shown to be extremely regime dependent. When bonds have negative returns, stocks and bonds tend to have a positive correlation—thereby defeating the purpose of using bonds as a diversifier to offset equity risk in the portfolio. We saw this first hand in 2022 when rising interest rates caused bonds to suffer losses while those same rising interest rates resulted in losses in stock valuations in the equity markets.
Furthermore, the use of bonds as a retirement strategy comes with no protections against interest rate risk and credit risk.
Losing millions of dollars via fees that eat up 20% or more of the clients after-tax return for retirement solutions that don’t actually provide retirement benefits, is a heavy loss for the client and their beneficiaries.
The only one who really benefits from this arrangement is the advisor who gets to easily scale a business by adding the client to same investment model and strategy that all his or her other retirement clients are in while spending minimal time on addressing issues that could add economic value to the client on an individual level.
Contact us by filling the form, and we’ll get back to you soon!
Contact UsAuthor

This blog post explores essential PPLI due diligence steps, covering carrier evaluation, regulatory considerations, investment platforms, tax compliance, and advisor expertise to help high-net-worth individuals make informed decisions before implementing this specialized insurance solution.

Discover how PPLI enhances business succession planning through key person insurance and buy-sell funding. Learn private placement life insurance strategies for business owners.

Learn how to evaluate PPLI carriers by balancing financial strength ratings against investment platform flexibility. Compare fee structures and long-term costs to select the optimal Private Placement Life Insurance carrier for your wealth strategy.
0 Comments